Data Visualization and reporting

Through data visualization and reporting, we transform complex data into clear and easily interpretable insights. We use advanced tools to create interactive dashboards, dynamic charts, and customized reports that support informed and strategic decision-making. Our solutions adapt to various industries and needs, providing visualizations that make information immediately understandable and facilitate data analysis.
Inmagik

Our data viz solutions

Our data visualization and reporting solutions are built on advanced open-source tools, allowing us to offer flexible and customized solutions.

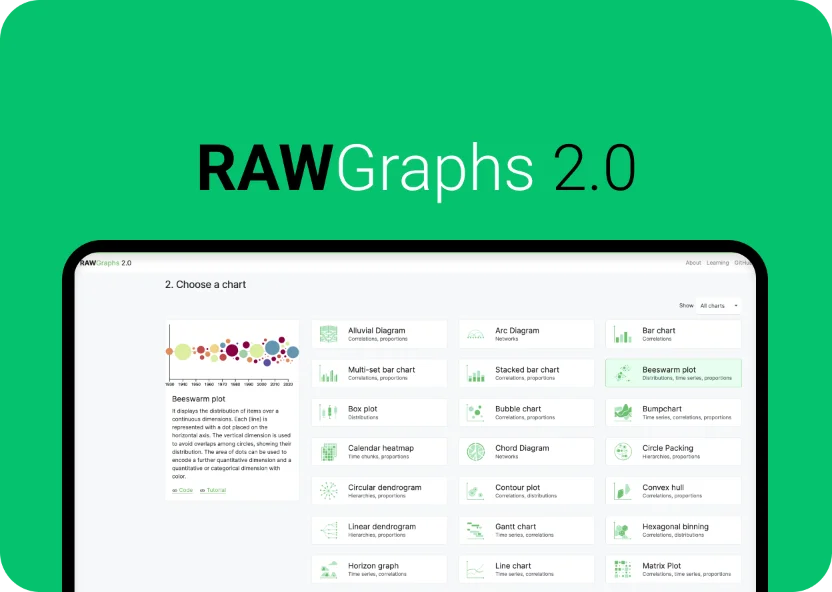
We are actively involved in the development of RawGraphs, an open-source project dedicated to creating complex and highly configurable data visualizations. This involvement enables us to leverage the most innovative technologies and contribute directly to the evolution of the tools we use.
placeholder
chevron right
Interactive dataviz development
We create interactive data visualizations to make complex information understandable and usable, facilitating decision-making and data analysis.
chevron right
Business reporting
We create custom and automated reports to monitor business performance, analyze data, and make informed decisions.
chevron right
Interactive maps
We integrate interactive maps into websites and applications to display geographic data, place points of interest, and provide directions.
chevron right
Automated reports
We automate the generation of periodic and custom reports to monitor performance, analyze data, and improve business productivity.
chevron right
Digital archive exploration
We create solutions to explore and consult digital archives, catalog and organize documents, images, videos, and other multimedia content, with advanced search features and content-based data visualizations.
chevron right
Custom dashboards
We create custom dashboards to monitor business data in real time, display KPIs and performance metrics, and analyze data in an intuitive and effective way.
placeholder
The technologies we use
Javascript
Javascript
Python
Python
D3
D3

Hai bisogno di una data visualization?

Thanks to our team of expert developers, we are ready to transform your ideas into successful digital realities.